Through three quarters, 2015 is shaping up to be a unique year in several different ways.
State Street debuted its suite of sector ETFs in 1998, meaning that the nine “sector SPDRs” will soon complete their 17th full year. That stretch has seen bull and bear markets, dramatic reversals, and repeated reshuffling of leadership.
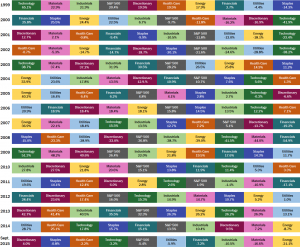
The image below summarizes the performance for the nine sector ETFs, as well as the S&P 500 SPDR (SPY), during each full year and through the first nine months of 2015 (click on the image for a larger version):
There is no shortage of insights that can be drawn from the above data. Below are a few observations:
- Eight sectors have been the best performer in at least one year since 1999 — only Materials has not yet led (and this year isn’t looking like the year that streak ends);
- Seven sectors have been the worst performer in at least one year since 1999 — Materials and Industrials (only Energy has had a worse 2015 than these two);
- There has failed to be at least one gain of 10 percent or more from sector ETFs only once since 2002 (through three quarters, Consumer Discretionary leads with a gain of 4 percent);
- Health Care is on pace to beat the S&P 500 for the fifth straight year, the longest active streak (Materials are on pace to lag the market for the fifth consecutive year).
See a complete list of sector ETFs here, and see a look at some of the strange sector classifications.
About the Author: Michael Johnston
Michael Johnston is senior analyst for ETF Reference, and also serves as COO of parent company Poseidon Financial. His investment expertise has been featured in The Wall Street Journal, Barron’s, and USA Today, among other publications. He resides in Chicago.
Comments